
Originally published on X/Twitter and LinkedIn on November 4, 2024
Imagine leading a double life. At work, you’re known by your employee ID - a simple number that uniquely identifies you in the company’s systems. At home, you have a physical address where you actually live. Your employee ID might be #1234, but that doesn’t tell anyone where you actually reside at 403 Park Street.
This dual identity system might seem unnecessary at first, but it’s brilliant in its simplicity. Your company doesn’t need to know when you move houses - you just update your address in HR, and your employee ID stays the same. Your colleagues can still find you in the company directory, send you messages, and collaborate with you, completely unaware of your physical location changes.
This is exactly how memory works in modern computers! When you write code, you’re dealing with “virtual addresses” - like employee IDs for your data. Meanwhile, the operating system quietly manages the “physical addresses” - the actual locations in RAM where your data lives.
In modern computing, understanding memory management is crucial, especially for developers working on system-level or performance-critical code. A key part of this is knowing the difference between virtual and physical addresses.
But, why does this matter? Well, understanding how your OS manages memory can help you:
- Write faster, more secure code
- Debug those frustrating, unexpected bugs that pop up
- Make better design decisions in your applications
Let’s see this in action with a simple example:
We’ll walk through a simple C++ example to see how this works, but rest assured, these concepts apply to any programming environment.
In C and C++ programming, pointers are a fundamental concept that allows developers to work with memory addresses directly. Consider this:
int i = 10;
int *pi = &i;
Here, pi is a pointer that holds the address of the variable i.
But what exactly is this address? Is it a physical location in the computer’s RAM, or is it something else? Let’s find out!
The Basics: Virtual vs Physical Addresses
Virtual Addresses
The address stored in our pointer pi is actually a virtual address. Think of virtual addresses like a postal address for your program’s memory. When your program requests memory (through malloc, new, or similar operations), it receives virtual addresses. And, this address is part of a virtual address space that the operating system allocates to each process.
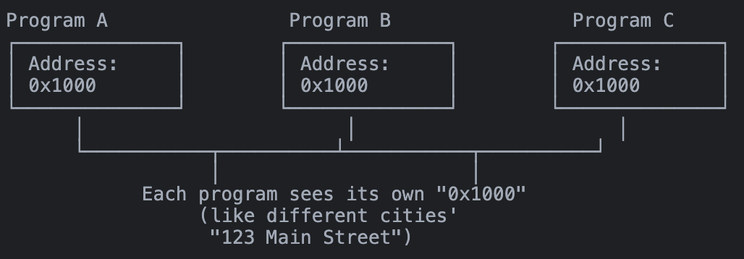
Benefits of Virtual Addresses:
-
Unique to your program: Each process gets its own virtual address space like having different cities with the same street names. Programs run independently without interfering with each other
-
Protected: Programs can’t access memory outside their space. Like having secure buildings where your key only works for your apartment.
-
Simplified Memory Model: Write code without worrying about physical layout, works with continuous addresses, like sending mail without knowing the delivery route
Physical Address
Physical addresses are the actual locations in your computer’s RAM where data is stored. Think of them as the GPS coordinates of your data. OS, with the help of hardware memory management unit (MMU), translates virtual addresses to physical addresses.
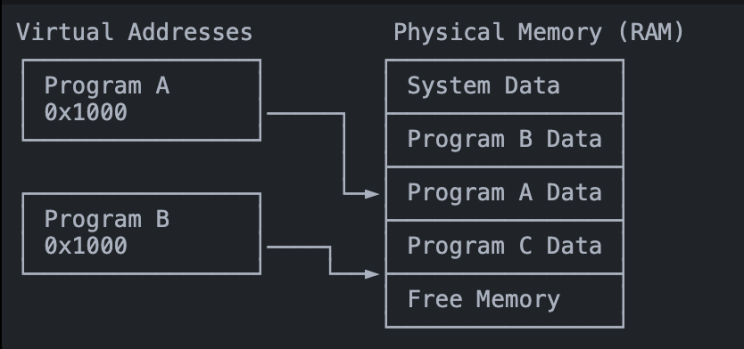
Key Characteristics:
-
Hardware Level: These are the real memory locations where data is stored, actual “GPS coordinates” of your data.
-
Managed by OS: OS handles virtual-to-physical mapping, like a postal service managing delivery routes
-
Not Visible: Programs never see physical addresses, works only with their virtual addresses
-
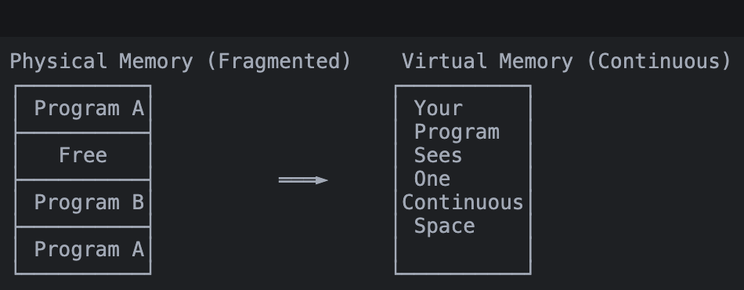
May Be Fragmented: Physical memory might not be continuous, OS handles this complexity transparently
Now that we understand the basics, let’s see how this works in practice…
How Virtual Memory Works in Practice
Let’s extend our earlier C++ example:
int array[1000];  // Allocate an array
int *ptr = &array[0];  // Get pointer to first element
Even though array appears continuous in our program’s virtual memory:
- The physical memory might be scattered across different locations
- Some parts might even be temporarily stored on disk
- Your program continues to work as if the memory is continuous
The Translation Process
When your program accesses memory:
- Your program uses a virtual address (like our pointer
ptr) - The Memory Management Unit (MMU) intercepts this request
- The MMU converts the virtual address to a physical location
- The data is accessed from RAM
How Virtual to Physical Address Translation Works
The translation from virtual to physical addresses can happen through different mechanisms, with paging being the most common in modern systems.
Paging System
Modern operating systems primarily use paging for memory management:
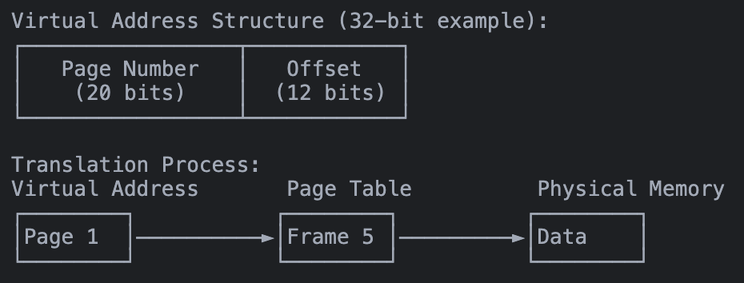
- Virtual memory is divided into fixed-size pages (typically 4KB)
- Physical memory is divided into frames of the same size
- Page tables map virtual pages to physical frames
- Each process has its own page table
// Example: When allocating memory
int* arr = new int[1024];  // 4KB (one page)
// The virtual address in 'arr' might be page 1
// Could map to physical frame 5
Segmentation
An older but still used method, especially in combination with paging.

- Memory divided into variable-sized segments
- Each segment has a base address and limit
- Commonly used for different program sections (code, data, stack)
// Different segments in your program
int globalVar;        // Data segment
void function() {     // Code segment
    int localVar;     // Stack segment
    int* heap = new int; // Heap segment
}
Memory Management Unit (MMU)
The MMU is the hardware that makes virtual memory possible:
Basic Operation
void* ptr = malloc(1024);  // Request memory
// When accessing: *ptr = 42;
// 1. CPU sends virtual address to MMU
// 2. MMU translates to physical address
// 3. Memory access proceeds
Key Functions
- Translates virtual addresses to physical addresses
- Manages access permissions (read/write/execute)
- Triggers page faults when necessary
- Uses page tables for translation
Protection Mechanism
// MMU prevents invalid access
int* ptr = nullptr;
*ptr = 42;  // MMU detects and triggers segmentation fault

const int readonly = 42;
int* bad_ptr = (int*)&readonly;
*bad_ptr = 43;  // MMU prevents writing to read-only memory
While understanding the mechanics of virtual and physical addresses is important, the real value comes from seeing how these concepts affect our daily work as developers. Let’s look at some common scenarios where this knowledge becomes invaluable.
Real-World Memory Management Scenarios

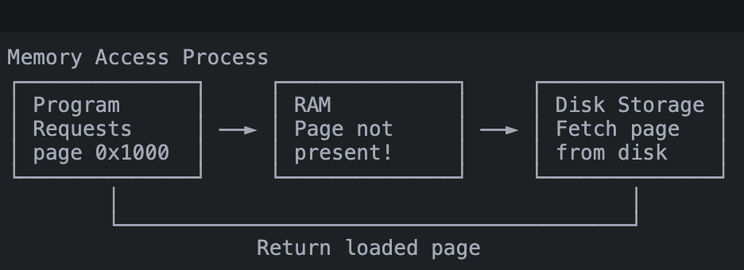
Page Faults: When Your Memory Isn’t Really There
Think of a page fault like going to get a book from your bookshelf, but finding a note saying “Book in storage” instead. The system needs to fetch it before you can read it.
Segmentation Faults: Crossing Memory Boundaries
Like trying to enter a building with an invalid key card - the security system (MMU) immediately stops you.
// Common segfault scenarios:

// 1. Null pointer access
int* ptr = nullptr;
*ptr = 42;  // 💥 CRASH! MMU prevents access to address 0

// 2. Accessing freed memory
int* ptr = new int(42);
delete ptr;
*ptr = 43;  // 💥 CRASH! Memory no longer belongs to us

// 3. Buffer overflow
int array[5];
array[1000] = 42;  // 💥 Might CRASH! Accessing beyond array bounds
Memory Fragmentation
Virtual memory turns a fragmented physical memory puzzle into a clean, continuous space for your program.
// Allocate several blocks
void* block1 = malloc(1024);  // 1KB
void* block2 = malloc(2048);  // 2KB

// Free middle block, creating fragmentation
free(block1);

// New allocation - virtual memory hides fragmentation
void* block3 = malloc(1024);  // Looks continuous to your program
Why This Matters for Developers
Practical Benefits
- Memory Safety: Programs are isolated from each other
- Efficient Memory Use: The OS can optimize memory allocation
- Simpler Programming: You can focus on logic, not memory layout
- Better Debugging: Memory errors are caught and reported clearly
Common Development Scenarios
- Debugging segmentation faults in C/C++
- Understanding memory leaks in any language
- Optimizing memory-intensive applications
- Working with large datasets efficiently
We’ve covered the theory and seen some common issues, but nothing beats a hands-on example. Let’s dive into a real memory leak situation and see how our understanding of virtual memory helps us diagnose and fix the problem.
Memory Leak Detection
Let’s put our understanding of virtual memory to work with a real-world example. We’ll create a situation where memory leaks occur and then detect them using native tools.
#include <iostream>
#include <memory>
#include <vector>
#include <chrono>
#include <thread>

// A class that simulates a resource-heavy object
class DataProcessor {
private:
    char* buffer;
    size_t bufferSize;
    static const size_t MEGABYTE = 1024 * 1024;

public:
    DataProcessor(size_t sizeInMB) : bufferSize(sizeInMB * MEGABYTE) {
        std::cout << "Allocating " << sizeInMB << "MB of memory at ";
        buffer = new char[bufferSize];
        std::cout << "virtual address: " << static_cast<void*>(buffer) << std::endl;

        // Simulate some initialization
        for (size_t i = 0; i < bufferSize; i += MEGABYTE) {
            buffer[i] = 'X';  // Touch each page to ensure allocation
        }
    }

    // Bug: Missing destructor - will cause memory leak!
    // ~DataProcessor() { delete[] buffer; }

    void process() {
        std::cout << "Processing data at " << static_cast<void*>(buffer) << std::endl;
        // Simulate processing
        std::this_thread::sleep_for(std::chrono::milliseconds(100));
    }
};

// Function that creates memory leak
void simulateMemoryLeak() {
    std::cout << "\n=== Starting Memory Leak Simulation ===\n";

    std::vector<DataProcessor*> processors;

    // Create multiple instances without proper cleanup
    for (int i = 0; i < 5; i++) {
        std::cout << "\nIteration " << i + 1 << ":\n";
        DataProcessor* processor = new DataProcessor(100);  // Allocate 100MB
        processors.push_back(processor);
        processor->process();

        // Bug: We're not deleting the processor
        // delete processor;
    }

    // Vector goes out of scope, but memory is never freed
}

// Corrected version using smart pointers
void simulateProperMemoryManagement() {
    std::cout << "\n=== Starting Proper Memory Management Simulation ===\n";

    std::vector<std::unique_ptr<DataProcessor>> processors;

    // Create multiple instances with automatic cleanup
    for (int i = 0; i < 5; i++) {
        std::cout << "\nIteration " << i + 1 << ":\n";
        processors.push_back(std::make_unique<DataProcessor>(100));
        processors.back()->process();

        // No need to manually delete - unique_ptr handles it
    }

    // Vector and all DataProcessors automatically cleaned up here
}

// Here's what we're going to look for:
// 1. Memory allocation patterns
// 2. Leak detection
// 3. Stack trace analysis

int main() {
    std::cout << "Memory Leak Detection Example\n";
    std::cout << "-----------------------------\n";

    //here is the leak
    simulateMemoryLeak();

    // how we are managing
    simulateProperMemoryManagement();

    return 0;
}
Take a look at the DataProcessor class, we are simulating a resource heavy project, named it as memoryLeak.cpp. On my macOS, I compiled this program and will use the built-in command-line tool leaks to detect memory leaks. For Linux, you can use valgrind with the command valgrind --leak-check=full ./memoryLeak, and for Windows, Visual Studio’s Memory Leak Detection tools are available.
# Compile with C++14 standard
g++ -std=c++14 memoryLeak.cpp -o memoryLeak

# Run with leak detection (on macOS)
leaks --atExit -- ./memoryLeak
Understanding the Output
When we compile and run our code with leak detection, we see something like this:
=== Starting Memory Leak Simulation ===

Iteration 1:
Allocating 100MB of memory at virtual address: 0x138000000
Processing data at 0x138000000

Iteration 2:
Allocating 100MB of memory at virtual address: 0x13e600000
Processing data at 0x13e600000

Iteration 3:
Allocating 100MB of memory at virtual address: 0x126e00000
Processing data at 0x126e00000

[... more iterations ...]

Process 19085: 15 leaks for 1048740000 total leaked bytes.
Let’s analyze what this tells us about virtual memory:
// When our code does this:
DataProcessor* processor = new DataProcessor(100);  // 100MB

// The leak detector shows:
// "Allocating 100MB of memory at virtual address: 0x138000000"
// This is a virtual address in our process's address space
Address Space Layout
Notice how subsequent allocations get different virtual addresses:
0x138000000
0x13e600000
0x126e00000
These non-sequential addresses demonstrate virtual memory fragmentation. The physical memory layout could be completely different.
This practical example helps us visualize:
- How virtual addresses are assigned
- How memory tools track allocations
- Why we only see virtual (not physical) addresses
- How memory leaks affect our virtual address space
A stack trace might look intimidating at first, but understanding it is crucial for debugging memory issues. Let’s break it down step by step.
Understanding Stack Traces
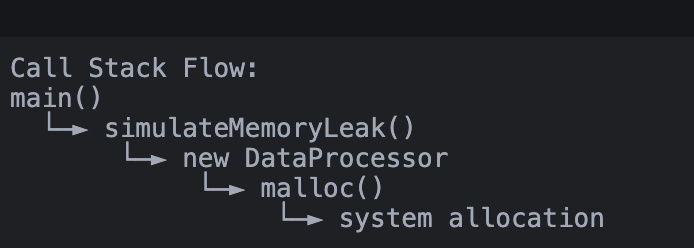
When the leak detector finds memory leaks, it provides a detailed stack trace that helps us understand exactly where the leak occurred:

This shows:
- Exact location of memory leaks
- Call stack leading to the leak
- Virtual addresses of leaked memory
Let’s break down this stack trace from top to bottom:
Program Entry (Level 5):
dyld                     0x199248274 start + 2840
// dyld is the dynamic linker, starting our program
Main Function (Level 4):
memoryLeak               0x104e6a9d8 main + 68
// Our program's main function called simulateMemoryLeak()
Leak Source (Level 3):
memoryLeak               0x104e6a420 simulateMemoryLeak() + 148
// The actual function where we forgot to free memory
Memory Allocation (Levels 2-0):
libc++abi.dylib          operator new(unsigned long) + 52
libsystem_malloc.dylib   _malloc + 88
libsystem_malloc.dylib   _malloc_zone_malloc_instrumented_or_legacy + 148
// Shows the internal allocation chain:
// our code -> new operator -> malloc -> system allocation
Best Practices
Do’s
- ✅ Use your language’s standard memory management tools
- ✅ Pay attention to memory allocation patterns
- ✅ Handle out-of-memory conditions
- ✅ Use debugging tools when memory issues occur
Don’ts
- ❌ Don’t assume physical memory layout
- ❌ Don’t try to outsmart virtual memory
- ❌ Don’t ignore memory warnings
- ❌ Don’t bypass memory protection mechanisms
Conclusion
So, what have we learned about this fascinating world of memory management? While the underlying system of virtual and physical addresses might seem complex (and trust me, it is!), understanding these basics makes us better developers. Think about it - every time you create a variable, allocate memory, or debug a segmentation fault, you’re working with virtual addresses without even realizing it.
Next time you’re debugging a memory leak or optimizing a performance-critical application, you’ll have a better understanding of what’s happening under the hood. It’s like having a map of the terrain – you might not need it every day, but when you do, you’ll be glad you have it.
Related Articles
If you enjoyed this deep dive into systems programming, you might also like:
-
The Hidden Cost of Messy Structs: Memory Alignment and Performance - How a simple reordering of struct fields can make your code 3x faster. A deep dive into memory alignment, padding, cache lines, and practical optimization strategies.
-
Algorithmic Optimizations: How to Leverage SIMD - Learn how to achieve 7x performance improvements through SIMD vectorization and register-level parallelism in C++.
If you found this article helpful and would like to stay connected, feel free to follow me on X/Twitter or connect with me on LinkedIn.